Stock Financial Analysis with Streamlit and Massive API
Building a stock financial analysis app using Streamlit and Massive API (formerly Polygon.io), deployed on Railway.

What is Streamlit?
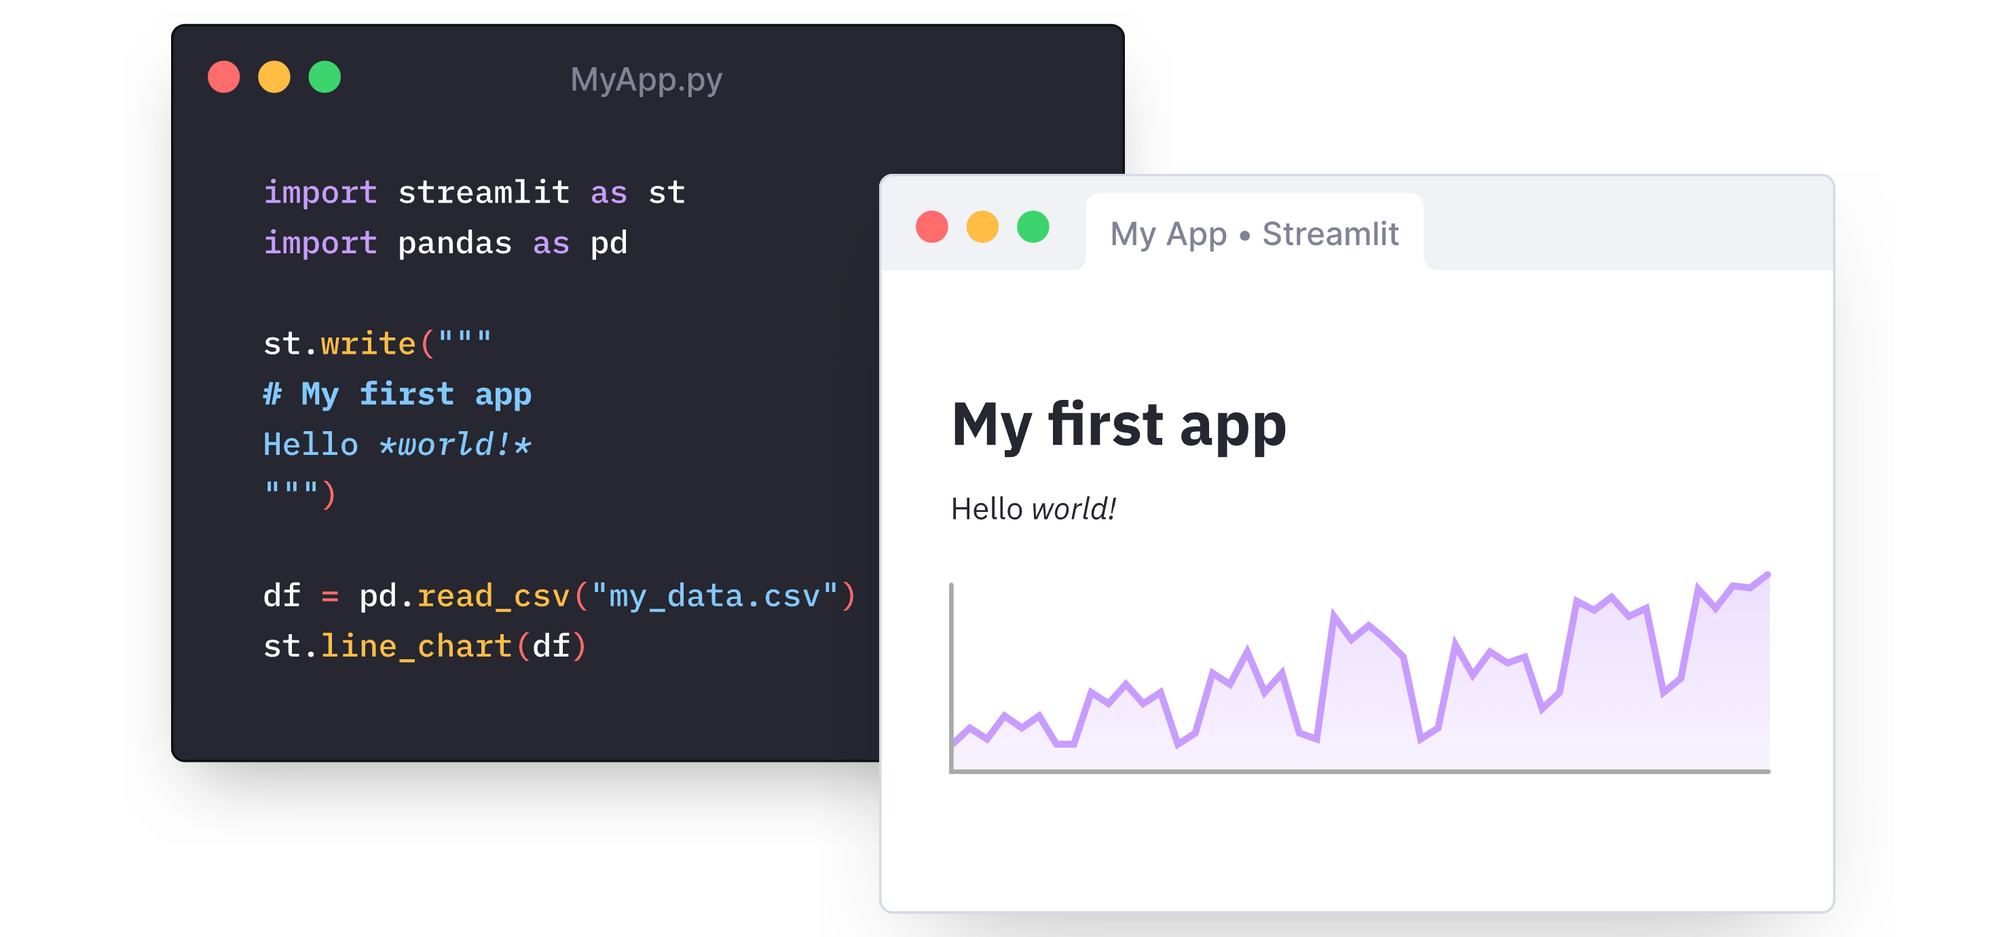
Streamlit is an open-source Python library that allows you to create and share interactive web apps and data visualisations in Python with ease. It includes built-in support for several data visualisation libraries like matplotlib, pandas, and plotly, making it easy to create interactive charts and graphs that update in real-time based on user input. Streamlit is quite popular among data scientists, machine learning engineers and developers looking to create and share interactive web apps with their audience.
Build a Streamlit App for Stock Financial Analysis
In this tutorial, we'll use Streamlit to create a simple app that displays financial metrics for a given stock ticker using the Massive API (formerly Polygon.io). Massive provides institutional-grade market data and client libraries to make it easy for developers to access and use the data. Create a free account with Massive and get an API key.
We'll also use the pandas and plotly libraries to render the visualisations, but you can also use matplotlib or others instead. The data that we need for this sample app, including stock, trade as well as historical financial information, is available across several Massive endpoints. I'll highlight code snippets below, but the entire code is in my GitHub repository.
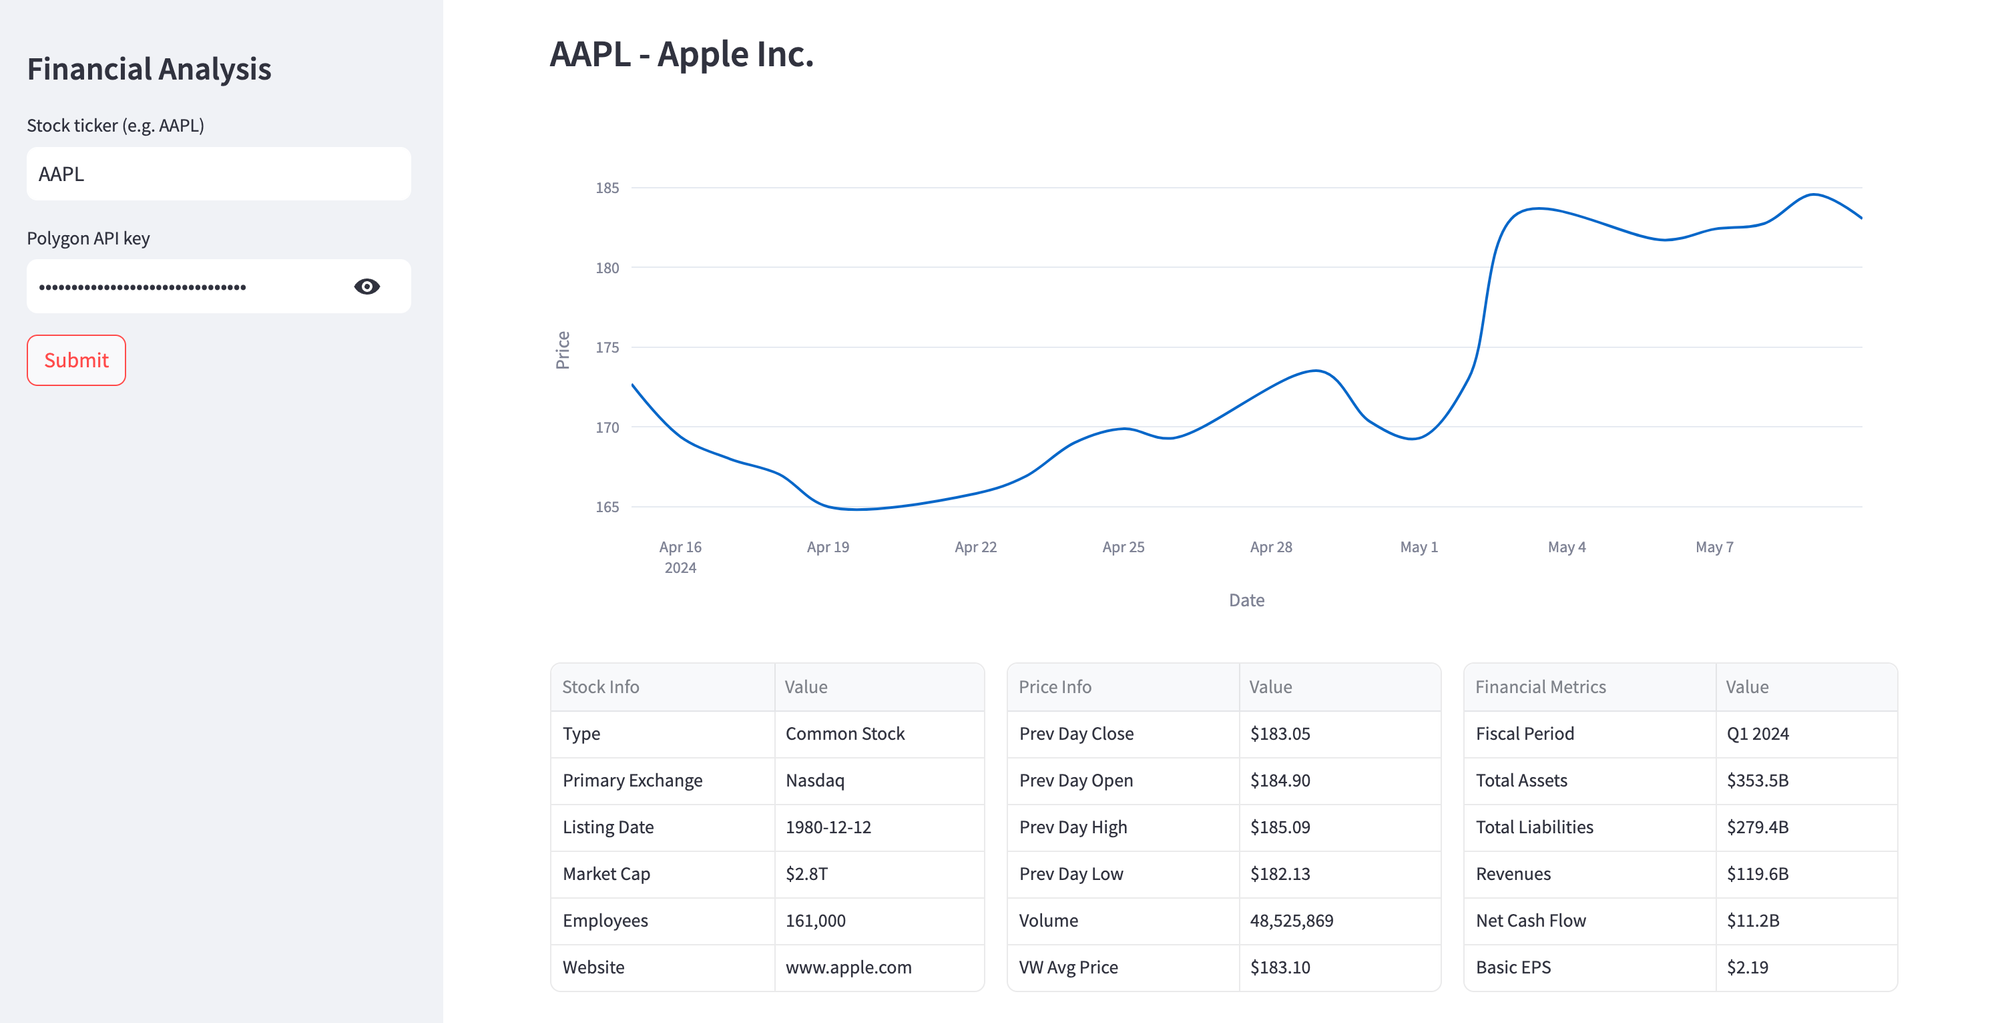
To render the historical stock price information, we'll use a Plotly line chart.
# Plot historical price chart for the last 30 days
end_date = datetime.now().date()
start_date = end_date - timedelta(days=30)

history = client.list_aggs(ticker, 1, 'day', start_date, end_date, limit=50)
chart_data = pd.DataFrame(history)
chart_data['timestamp'] = pd.to_datetime(chart_data['timestamp'], unit='ms')
chart_data['date'] = chart_data['timestamp'].dt.strftime('%Y-%m-%d')

price_chart = px.line(chart_data, x='date', y='close', width=1000, height=400, line_shape='spline')
price_chart.update_layout(
    xaxis_title="Date",
    yaxis_title="Price"
)

st.plotly_chart(price_chart)
We'll display the financial data in three columns - the first highlighting stock information like the sector, industry, market cap etc. Some fields require additional formatting for better readability.
# Display stock information as a dataframe
stock_info = [
    ("Stock Info", "Value"),
    ("Type", get_stock_type(info.type)),
    ("Primary Exchange", get_exchange_name(info.primary_exchange)),
    ("Listing Date", info.list_date),
    ("Market Cap", format_value(info.market_cap)),
    ("Employees", f"{"{:,.0f}".format(info.total_employees)}"),
    ("Website", info.homepage_url.replace("https://", ""))
]

df = pd.DataFrame(stock_info[1:], columns=stock_info[0])
col1.dataframe(df, width=400, hide_index=True)
The second column will highlight price information, rendered as a dataframe. We'll restrict each value to two decimal points only.
# Display price information as a dataframe
agg = client.get_previous_close_agg(ticker)

price_info = [
    ("Price Info", "Value"),
    ("Prev Day Close", f"${agg[0].close:.2f}"),
    ("Prev Day Open", f"${agg[0].open:.2f}"),
    ("Prev Day High", f"${agg[0].high:.2f}"),
    ("Prev Day Low", f"${agg[0].low:.2f}"),
    ("Volume", f"{"{:,.0f}".format(agg[0].volume)}"),
    ("VW Avg Price", f"${agg[0].vwap:.2f}")
]

df = pd.DataFrame(price_info[1:], columns=price_info[0])
col2.dataframe(df, width=400, hide_index=True)
Finally, we'll highlight some historical financial information using Massive's experimental endpoint. Unfortunately, I found the Massive APIs lacking several business metrics that were easily available via the Yahoo Finance API. Next, let's explore how to deploy this app and play around with it.
# Display historical financial information as a dataframe
fin = client.vx.list_stock_financials(ticker, sort='filing_date', order='desc', limit=2)

for item in fin:
    break

fin_metrics = [
     ("Financial Metrics", "Value"),
    ("Fiscal Period", item.fiscal_period + " " + item.fiscal_year),
    ("Total Assets", format_value(item.financials.balance_sheet['assets'].value)),
    ("Total Liabilities", format_value(item.financials.balance_sheet['liabilities'].value)),
    ("Revenues", format_value(item.financials.income_statement.revenues.value)),
    ("Net Cash Flow", format_value(item.financials.cash_flow_statement.net_cash_flow.value)),
    ("Basic EPS", f"${item.financials.income_statement.basic_earnings_per_share.value}")
]

df = pd.DataFrame(fin_metrics[1:], columns=fin_metrics[0])
col3.dataframe(df, width=400, hide_index=True)
Deploy the Streamlit App on Railway
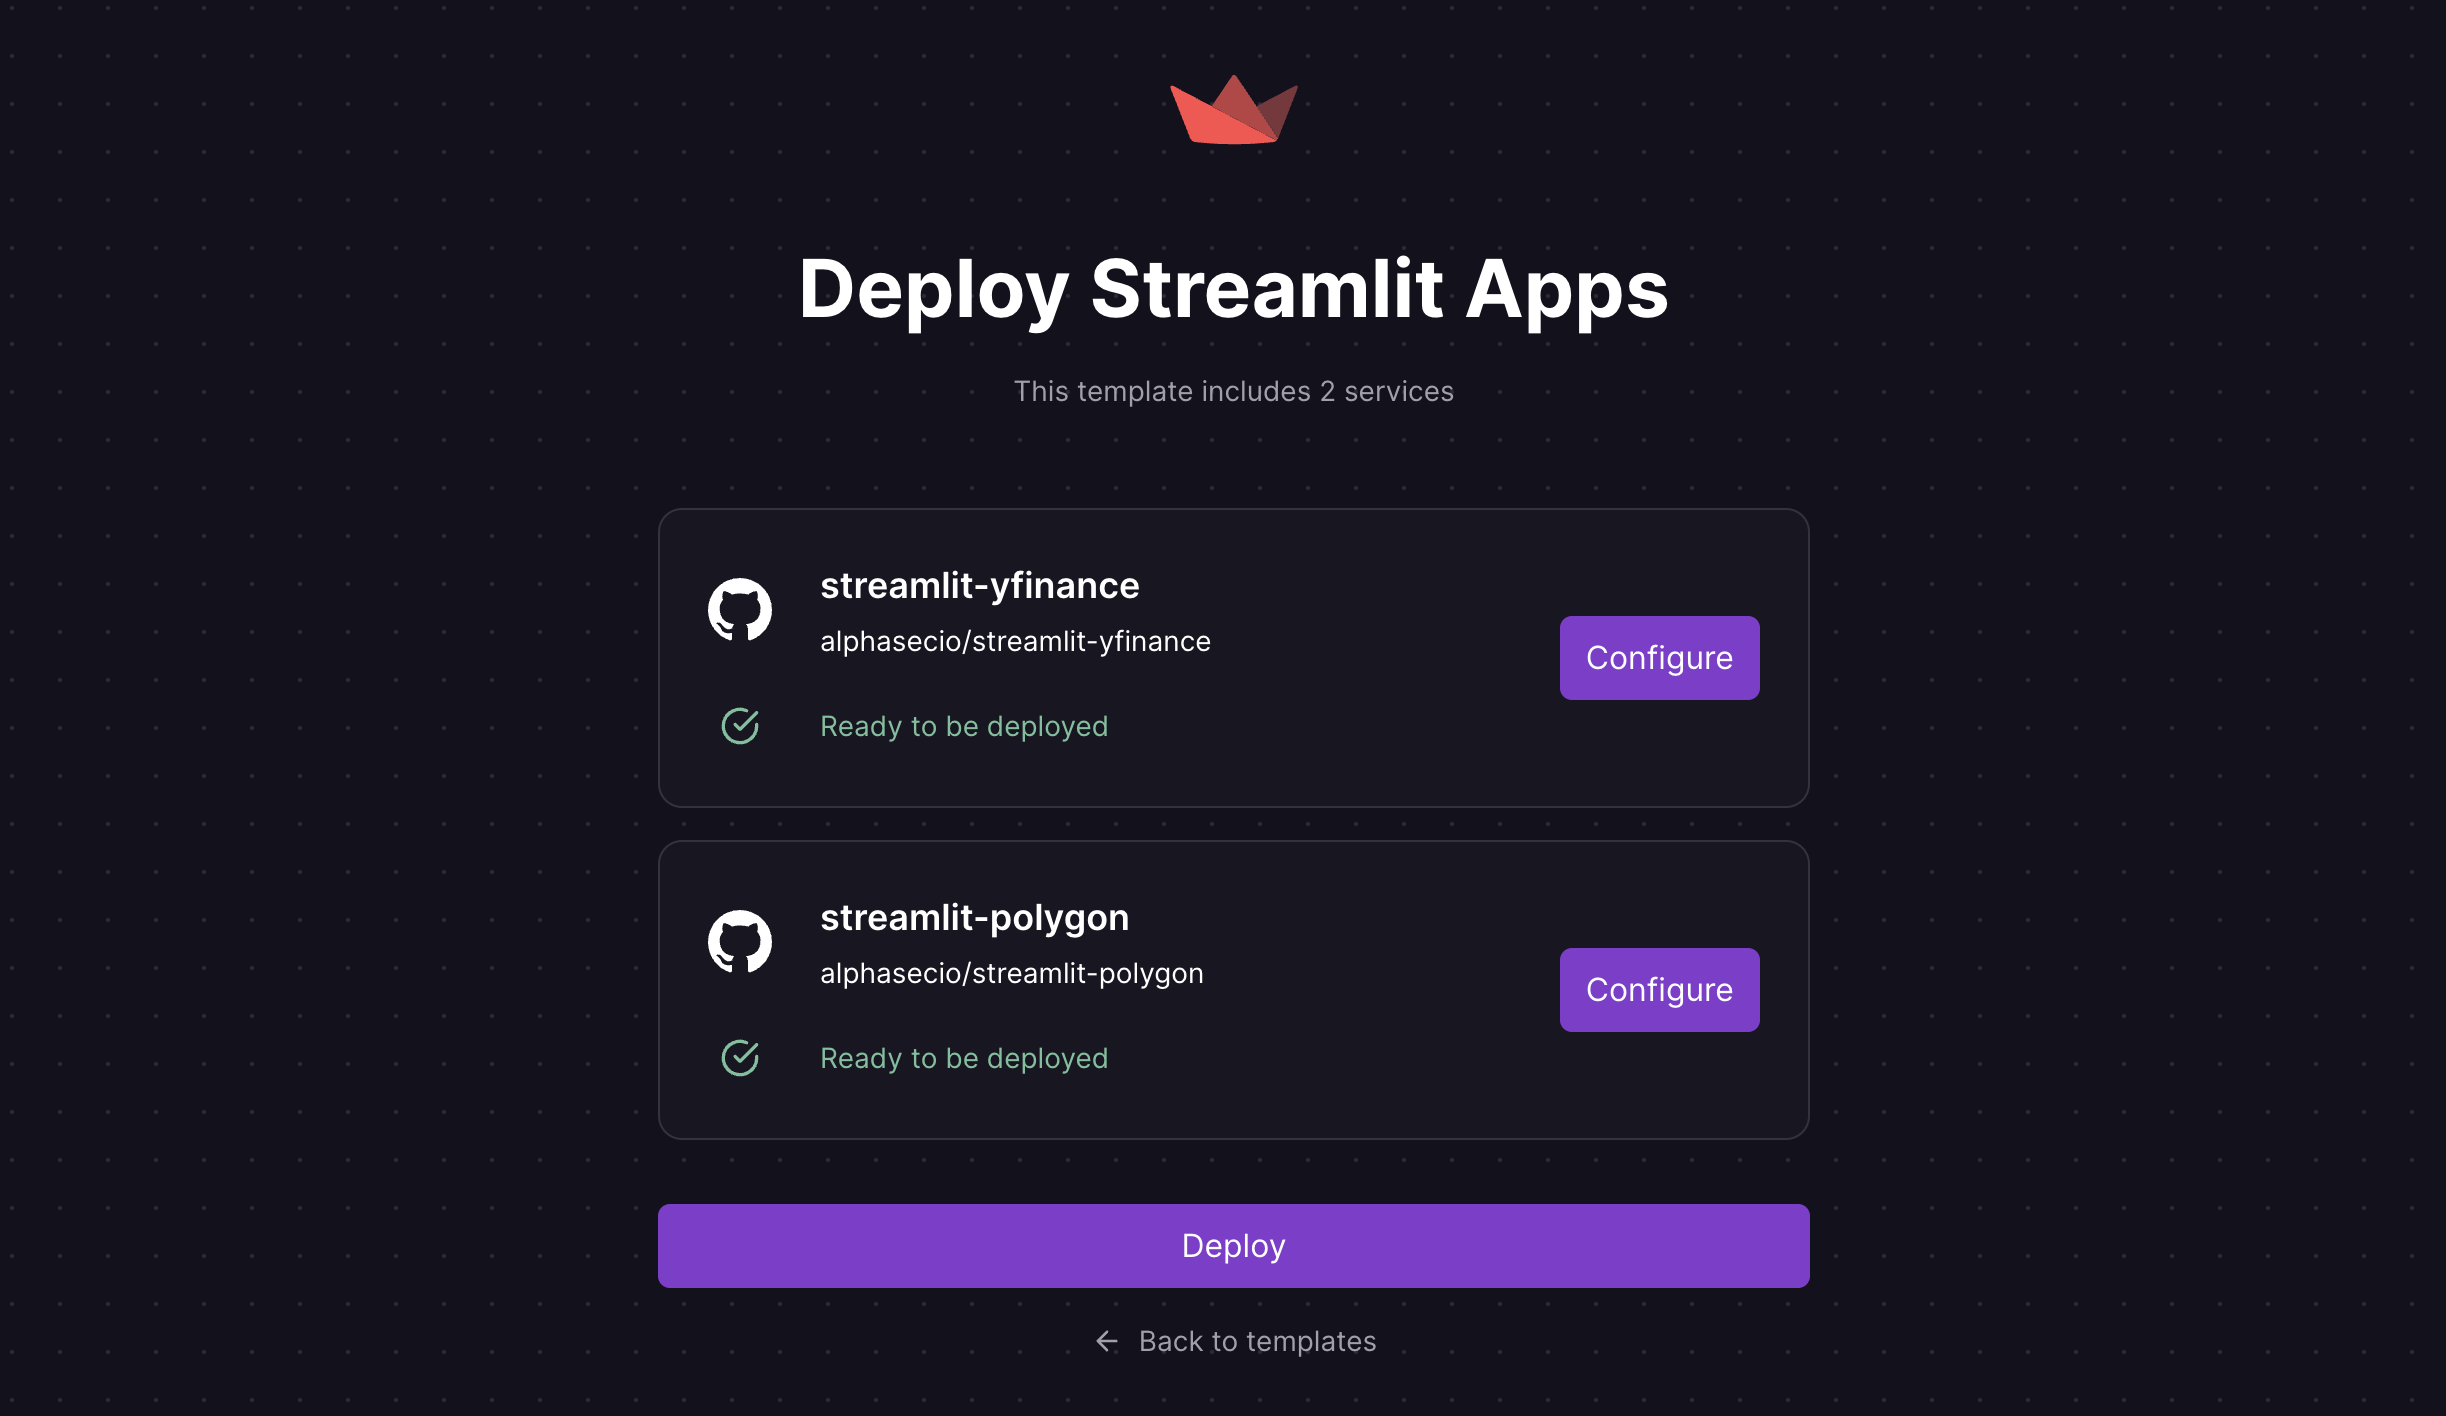
Railway is a modern app hosting platform that makes it easy to deploy production-ready apps quickly. Sign up for an account using GitHub, and click Authorize Railway App when redirected. Review and agree to Railway's Terms of Service and Fair Use Policy if prompted. Launch the Streamlit Apps one-click starter template (or click the button below) to deploy the app instantly on Railway.

This template also deploys a Streamlit app that uses the Yahoo Finance API for stock ticker information - see this post for more details. Accept the defaults and click Deploy; the deployment will kick off immediately.
Once the deployment completes, the Streamlit apps will be available at default xxx.up.railway.app domains - launch each URL to access the respective app. If you are interested in setting up a custom domain, I covered it at length in a previous post - see the final section here.
That's it! Provide different (valid) ticker symbols and explore the results. Also, explore the stock price changes over time based on selected time frames.
Retrieve Stock Information using Yahoo Finance API
If you want to try the Yahoo Finance API instead of Massive API, see this repository for a sample Streamlit web app. Launch the same one-click starter template (or click the button below) to deploy the app instantly on Railway.