Open-Source Business Intelligence with Redash
A brief guide to deploying open-source business intelligence platform, Redash, on DigitalOcean.
Open-source business intelligence platforms offer users access to data-driven insights without expensive overheads that typically come with proprietary solutions. They are designed to be used by developers, analysts, and business users alike, and help them make sense of their data as well as smarter decisions about their operations. In a previous post, I covered Metabase on Railway; today, let's explore another open-source tool, Redash, on DigitalOcean.
What is Redash?
Redash is an open-source software that enables you to query, visualise, and share data from any data source, including relational databases, NoSQL databases, and other sources like APIs and spreadsheets. It includes an online SQL editor to query ingested data, and can easily create visualisations to share insights from the data. The hosted Redash service was shut down in 2021, so you can either use Redash on Databricks, or host the open-source version yourself; we'll explore the latter today.
Install Redash on a DigitalOcean Droplet
For this walk-through, I'll use DigitalOcean; if you don't have an account, sign up here - you’ll receive a $200, 60-day credit when you add a valid payment method. Set up your team and project, and deploy the Redash 1-Click Droplet from the marketplace. This droplet includes the Redash, Postgres, Redis, Docker CE and Docker Compose packages, along with their respective dependencies. Click Create Redash Droplet, select the data center region, the CPU option, an authentication option, the hostname, and click Create Droplet. Once the droplet is ready, navigate to the droplet IP address in your web browser - you'll see the initial setup screen.
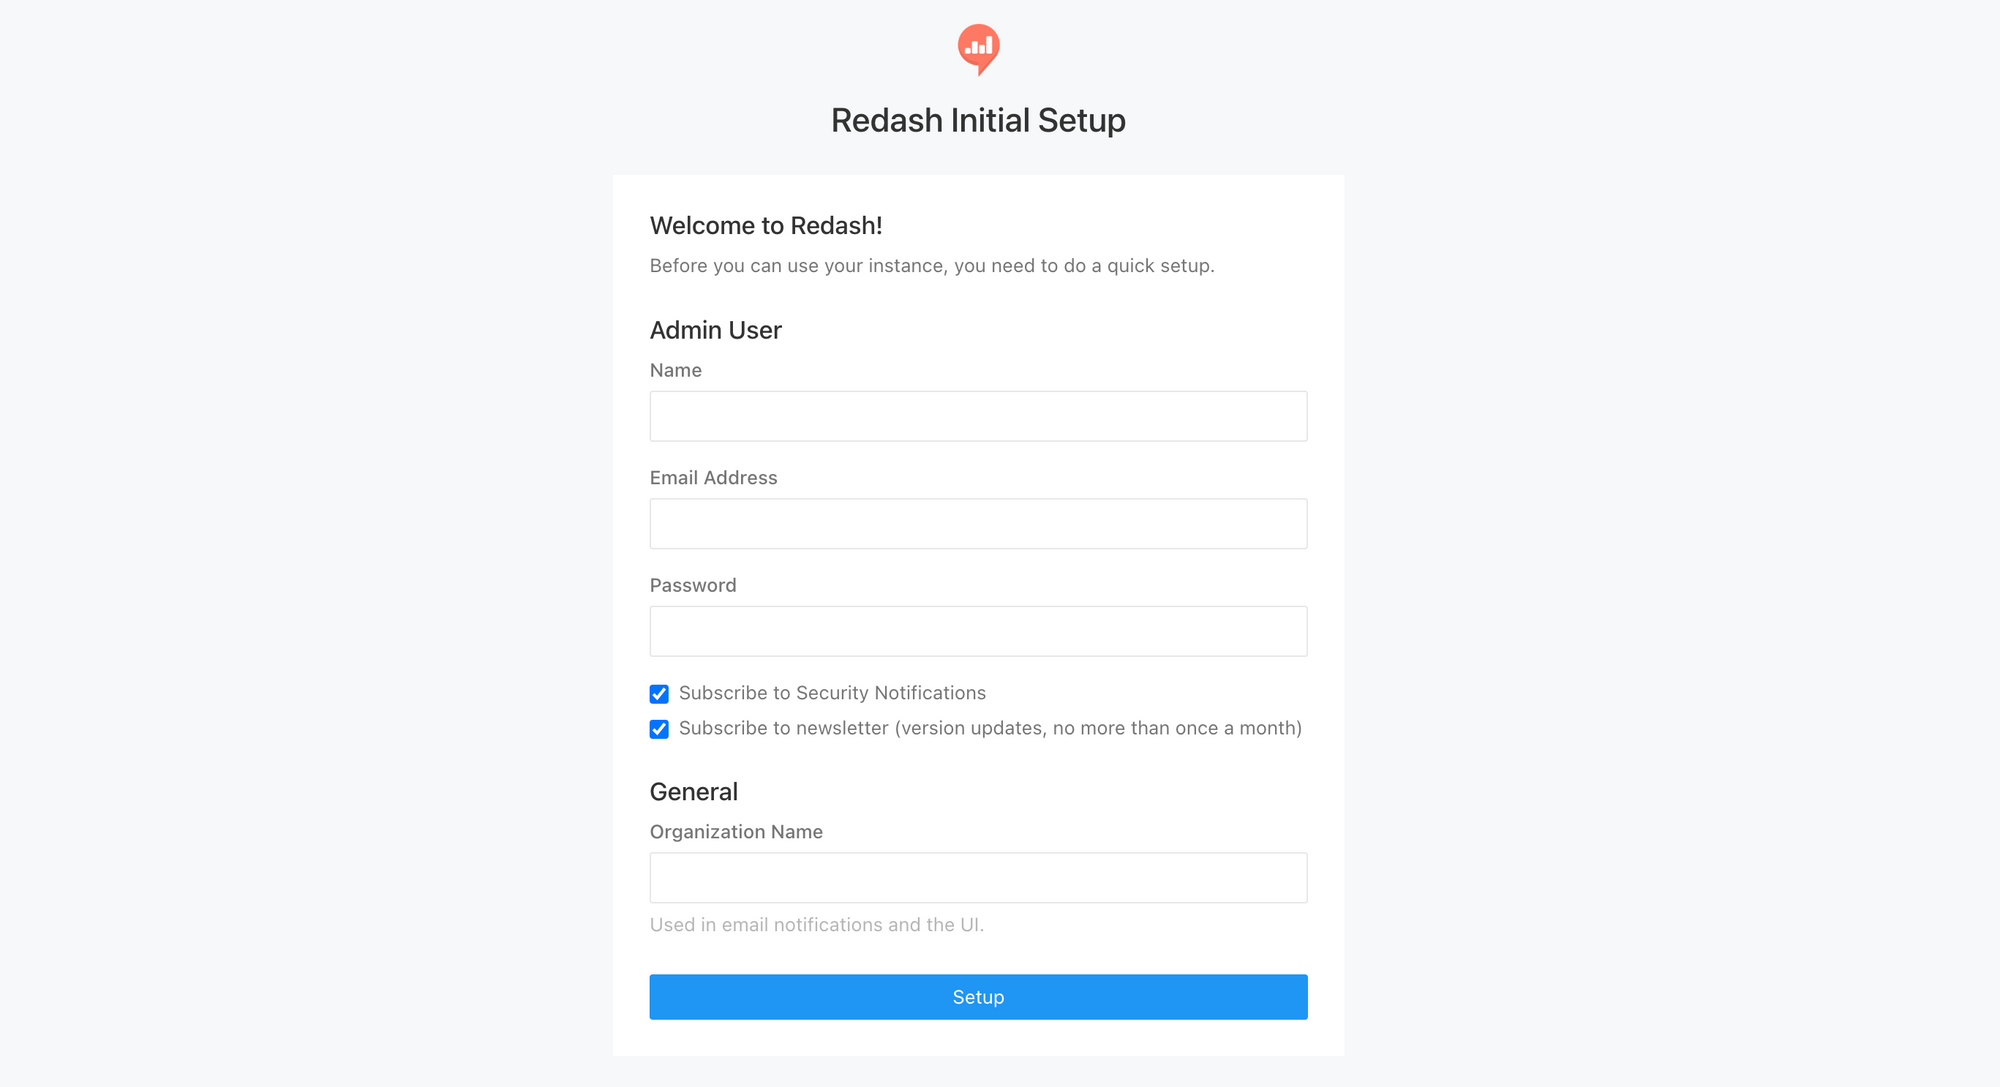
Specify the admin user Name, Email Address, Password and Organization Name, and click Setup. On the next page, login with the admin user credentials.
Configure the Redash Instance
The first thing you may notice is that the open-source version does not offer TLS encryption by default. Follow the instructions here to configure HTTPS for this instance. Alternatively, see this if you plan to use a proxy like Cloudflare instead.
For Redash to send emails (user invites, password resets, alerts), you need to configure the mail server using environment variables. SSH to the droplet using the root credentials, and provide the following details in /opt/redash/env:
REDASH_MAIL_SERVER(default: localhost)REDASH_MAIL_PORT(default: 25)REDASH_MAIL_USE_TLS(default: false)REDASH_MAIL_USE_SSL(default: false)REDASH_MAIL_USERNAME(default: None)REDASH_MAIL_PASSWORD(default: None)REDASH_MAIL_DEFAULT_SENDER(default: None)REDASH_HOST(base DNS or IP address e.g.https://redash.example.com)
Once you've updated the file, restart all services using docker-compose up -d. To test the email configuration, run docker-compose run --rm server manage send_test_mail.
Getting Started with Redash
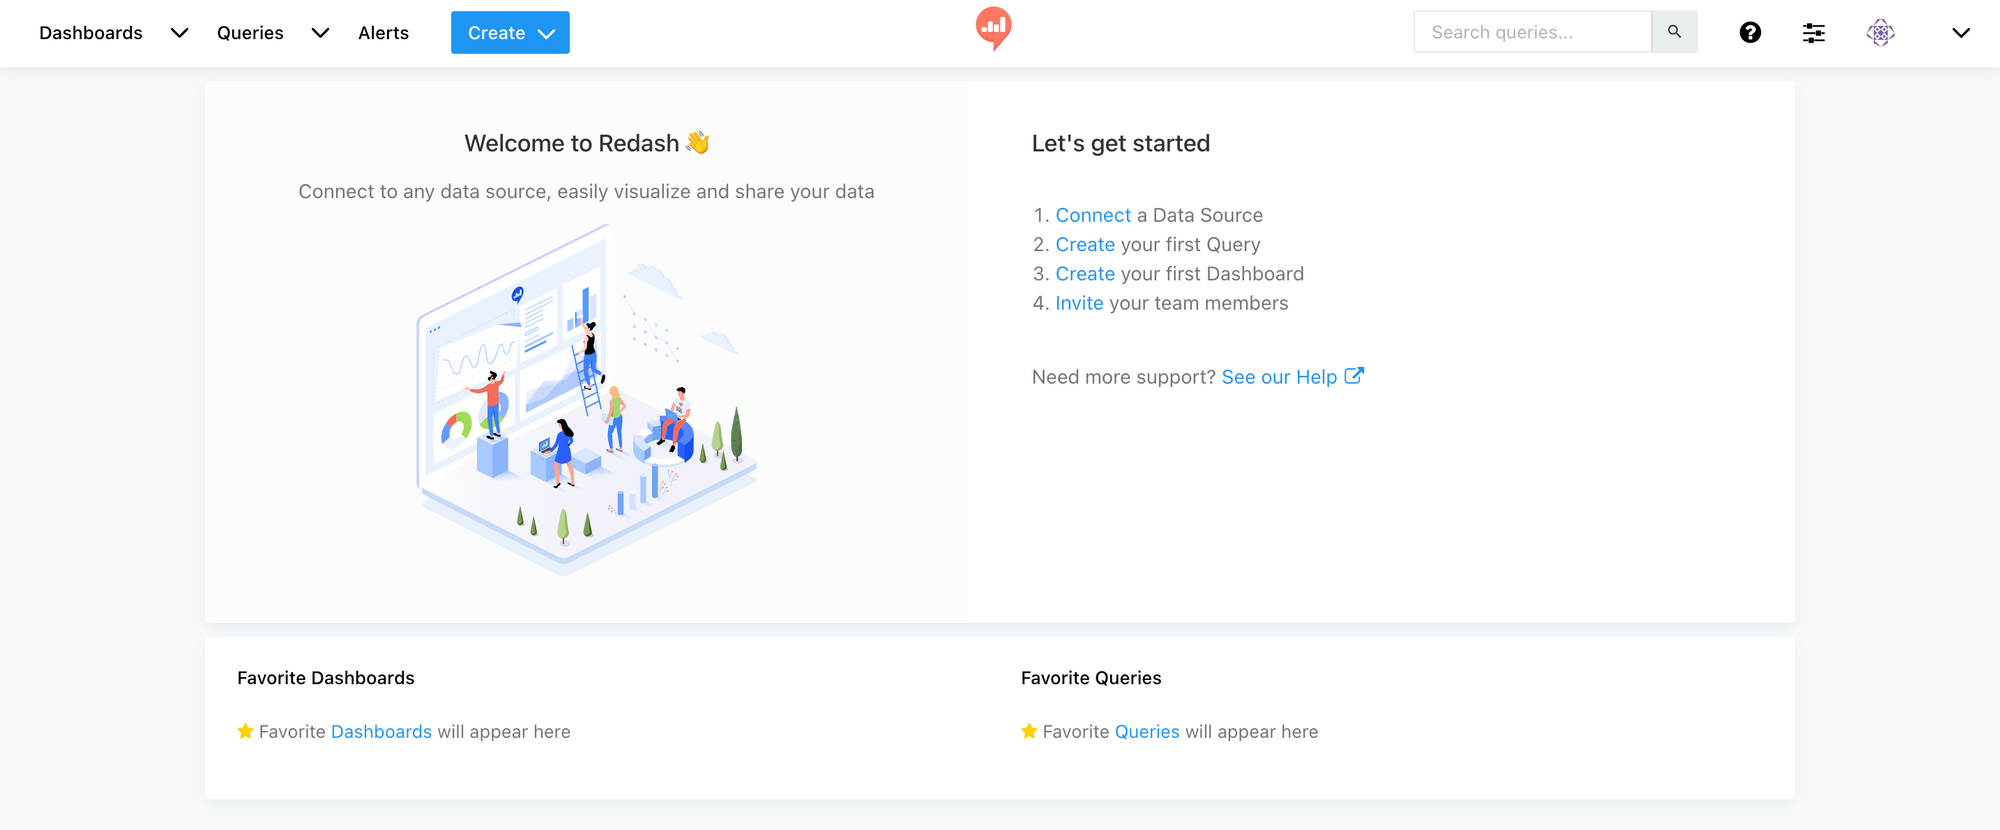
Now that the initial configuration is done, let's connect a data source, run a query, and prepare some visualisations. Click Connect a Data Source from the dashboard, or click the organization settings > Data Sources > New Data Source to connect a supported data source. Ideally, you should use an account with read-only privileges to connect to the data source.
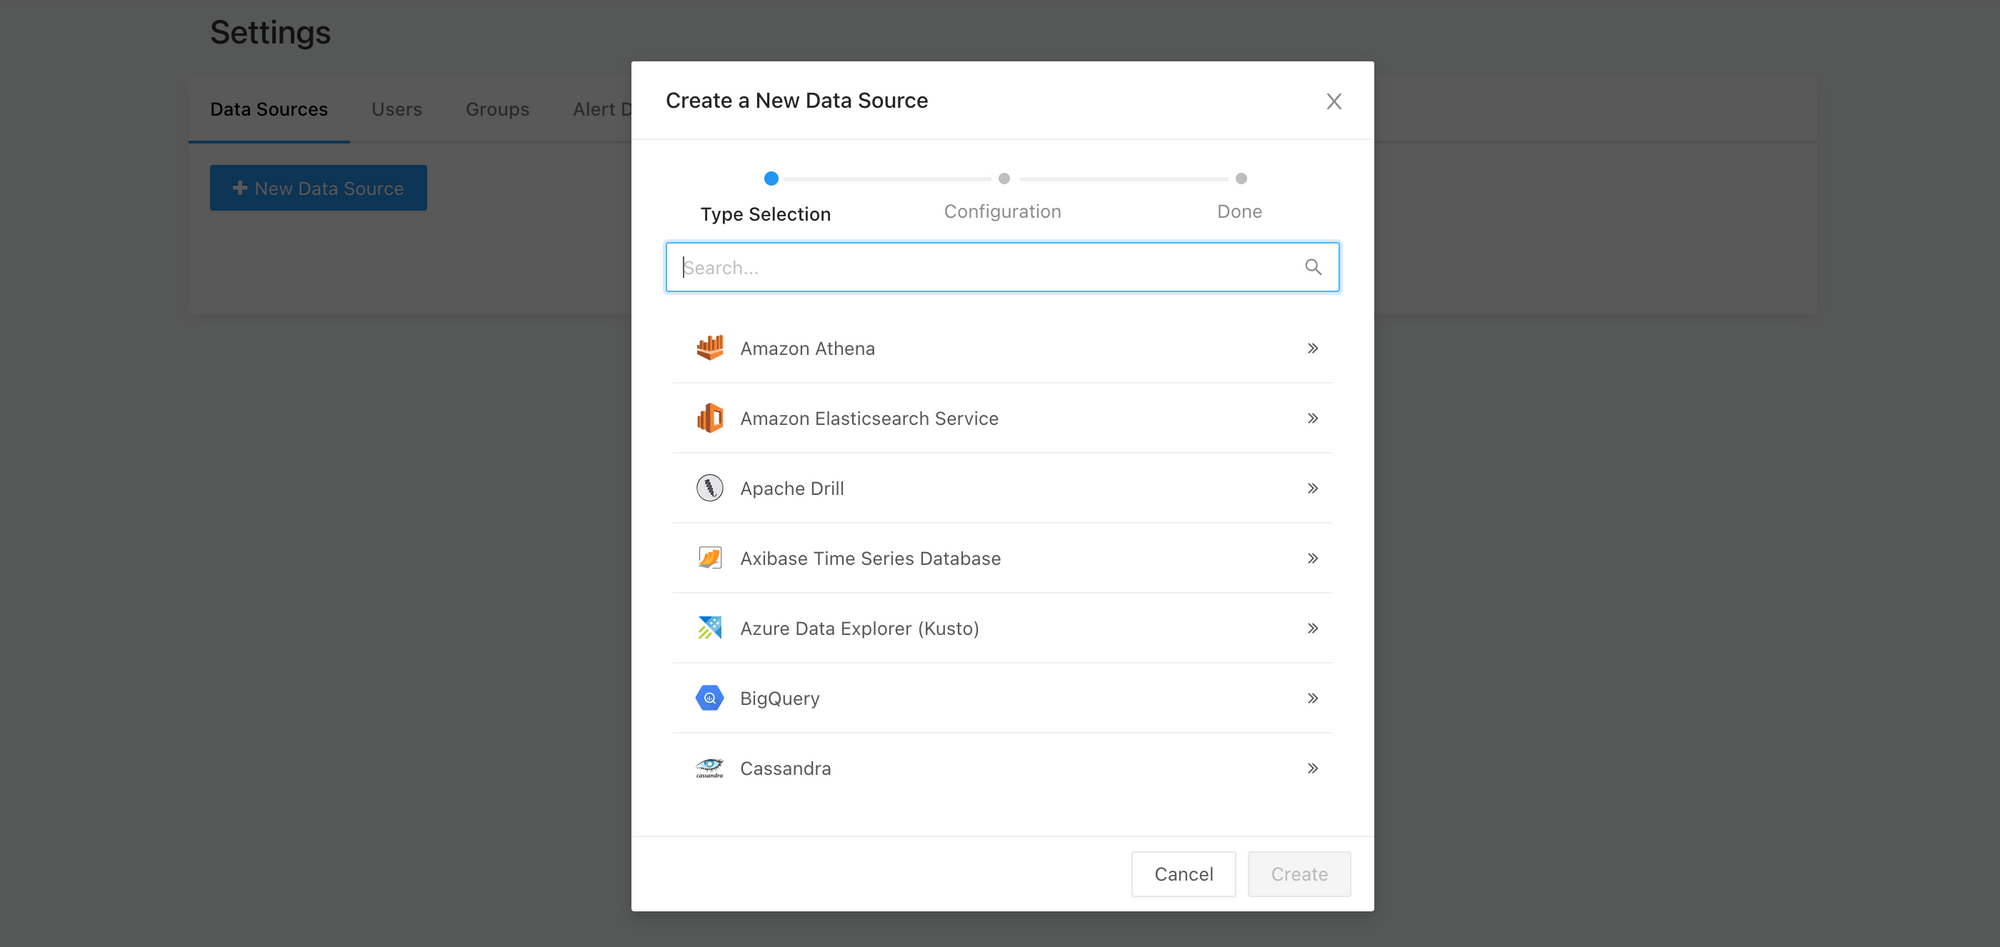
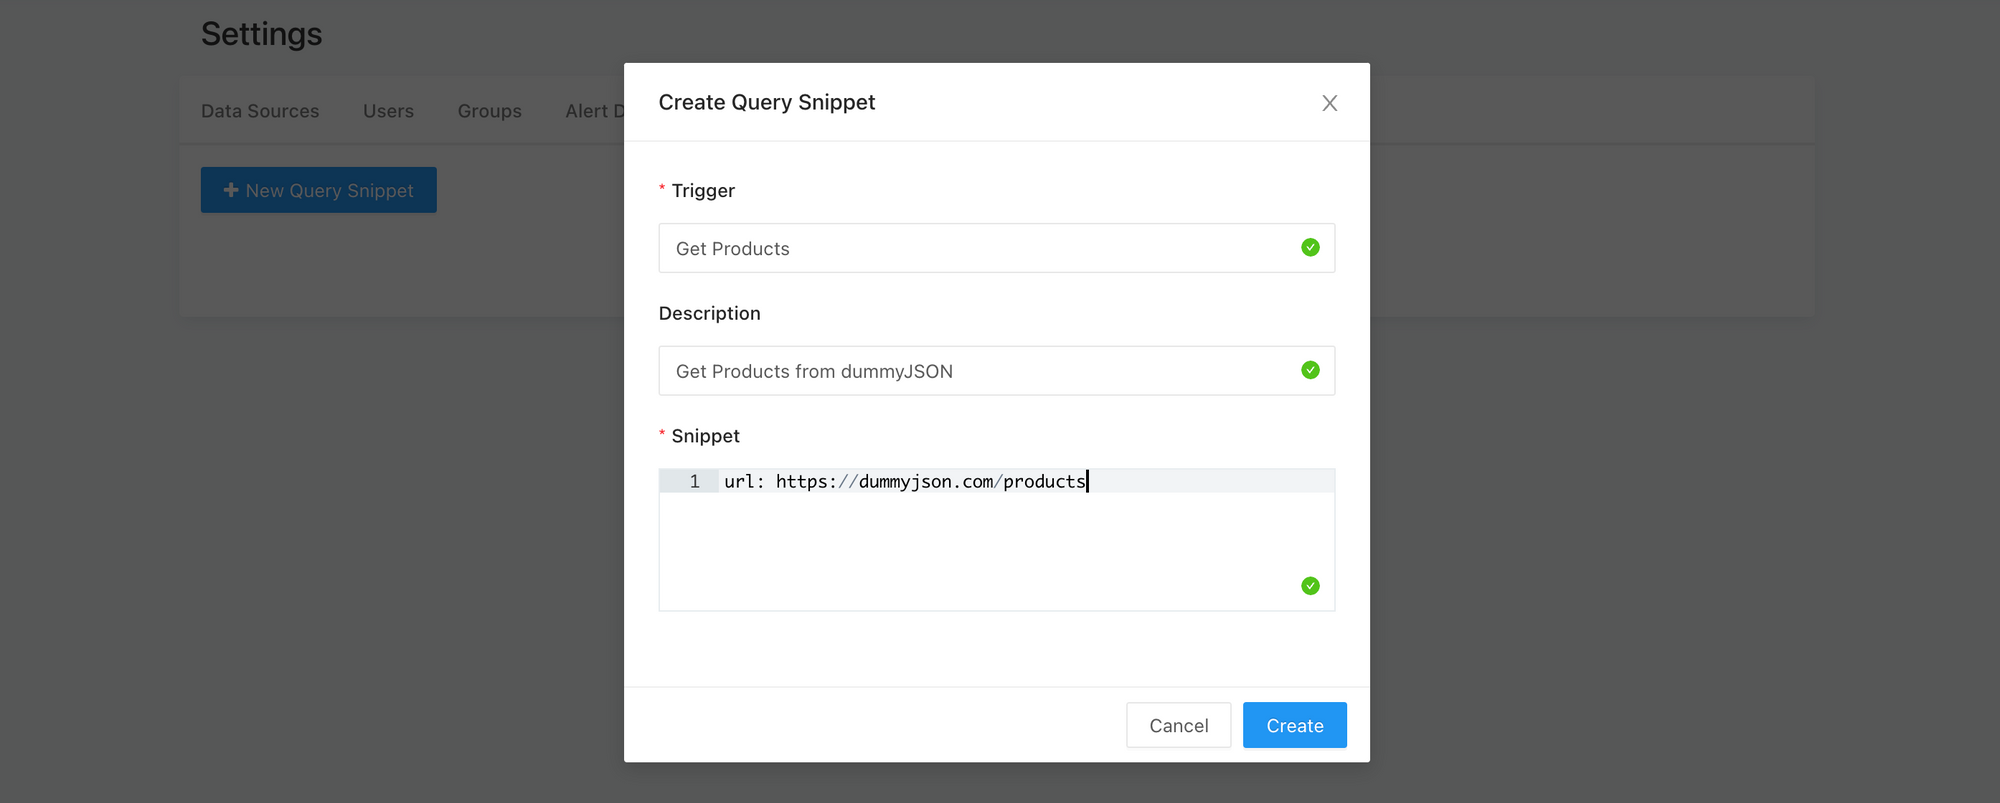
For this walk-through, I'll select the JSON data source, click Create, specify the Name as Products, and click Create again. I'll use the (unauthenticated) products endpoint from dummyJSON to populate the data. Click Query Snippets > New Query Snippet, specify the Trigger and Snippet (i.e. the JSON URL to fetch data from) details, and click Create.
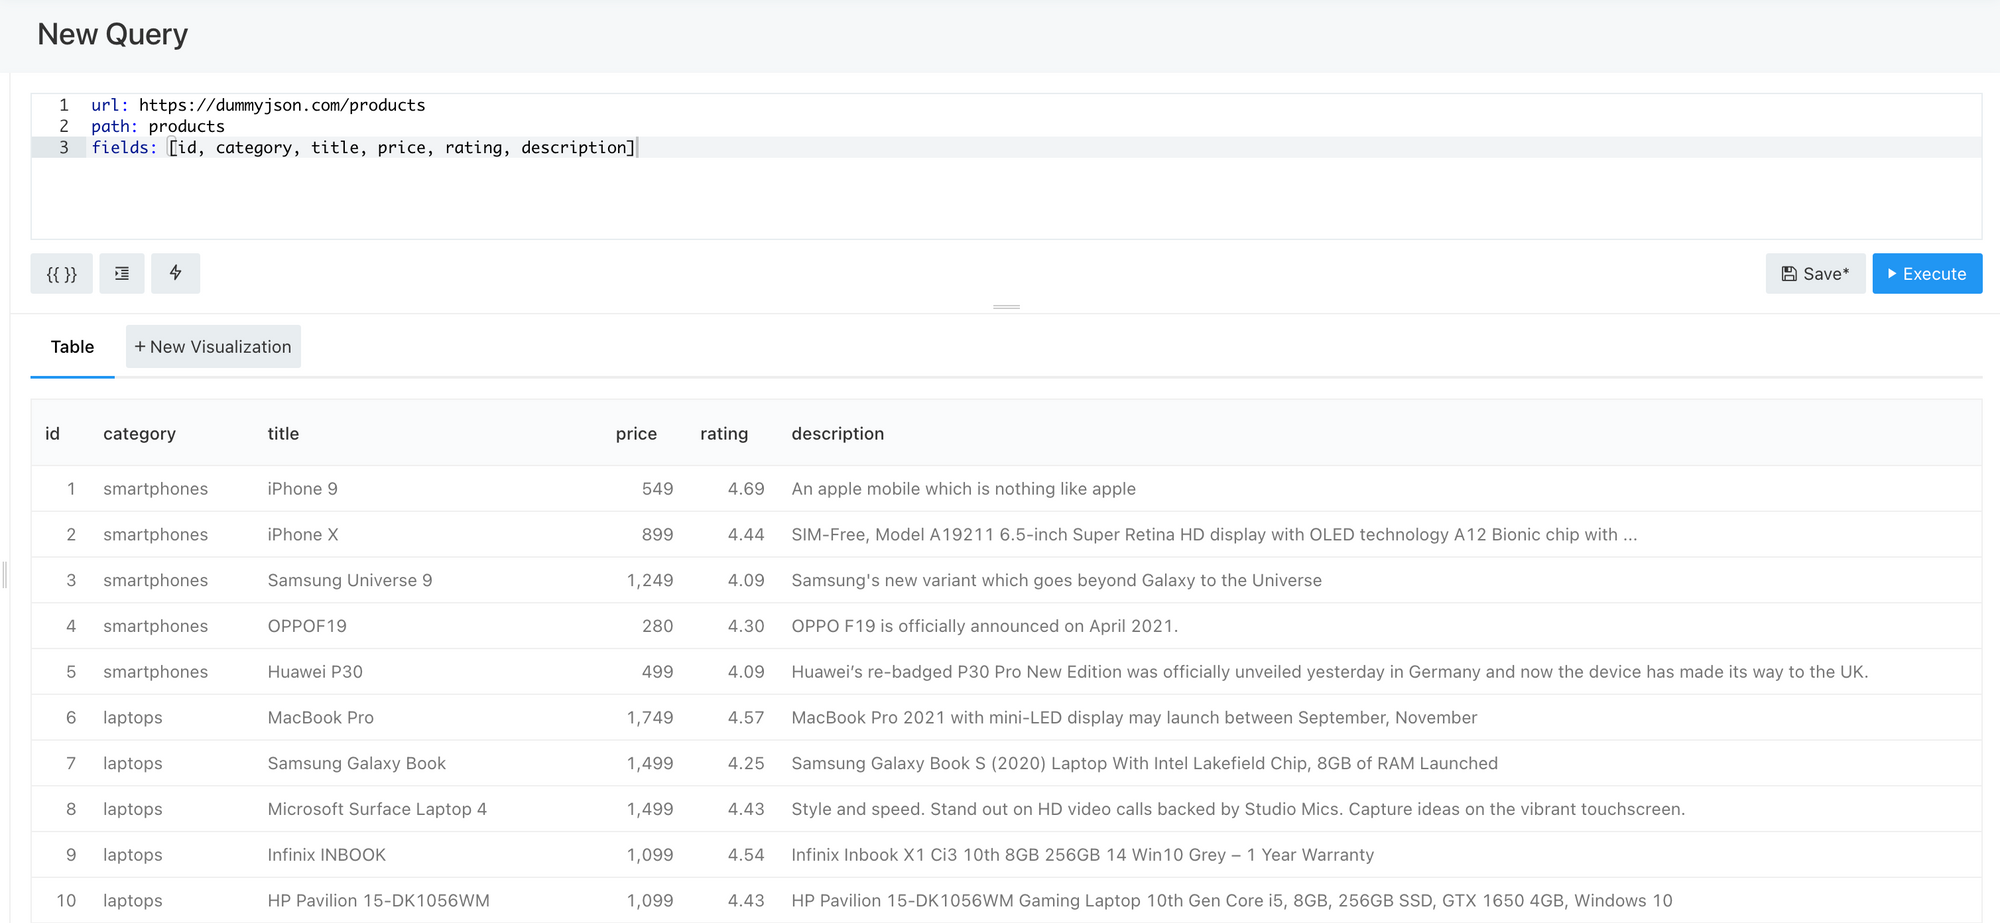
Next, click Create your first Query from the dashboard, or click Query from the Create drop-down menu. Select the query snippet and click Execute. I added the keys path (to access the inner JSON objects) and fields (to limit the data returned) to map the dummyJSON endpoint data accurately.
Click New Visualisation to launch the visualisation editor. Redash offers a nice variety of visualisation types - charts, tables, maps, cohorts, counters, funnels, sankeys, word clouds, pivot tables are more. Create your desired visualisation and click Save.
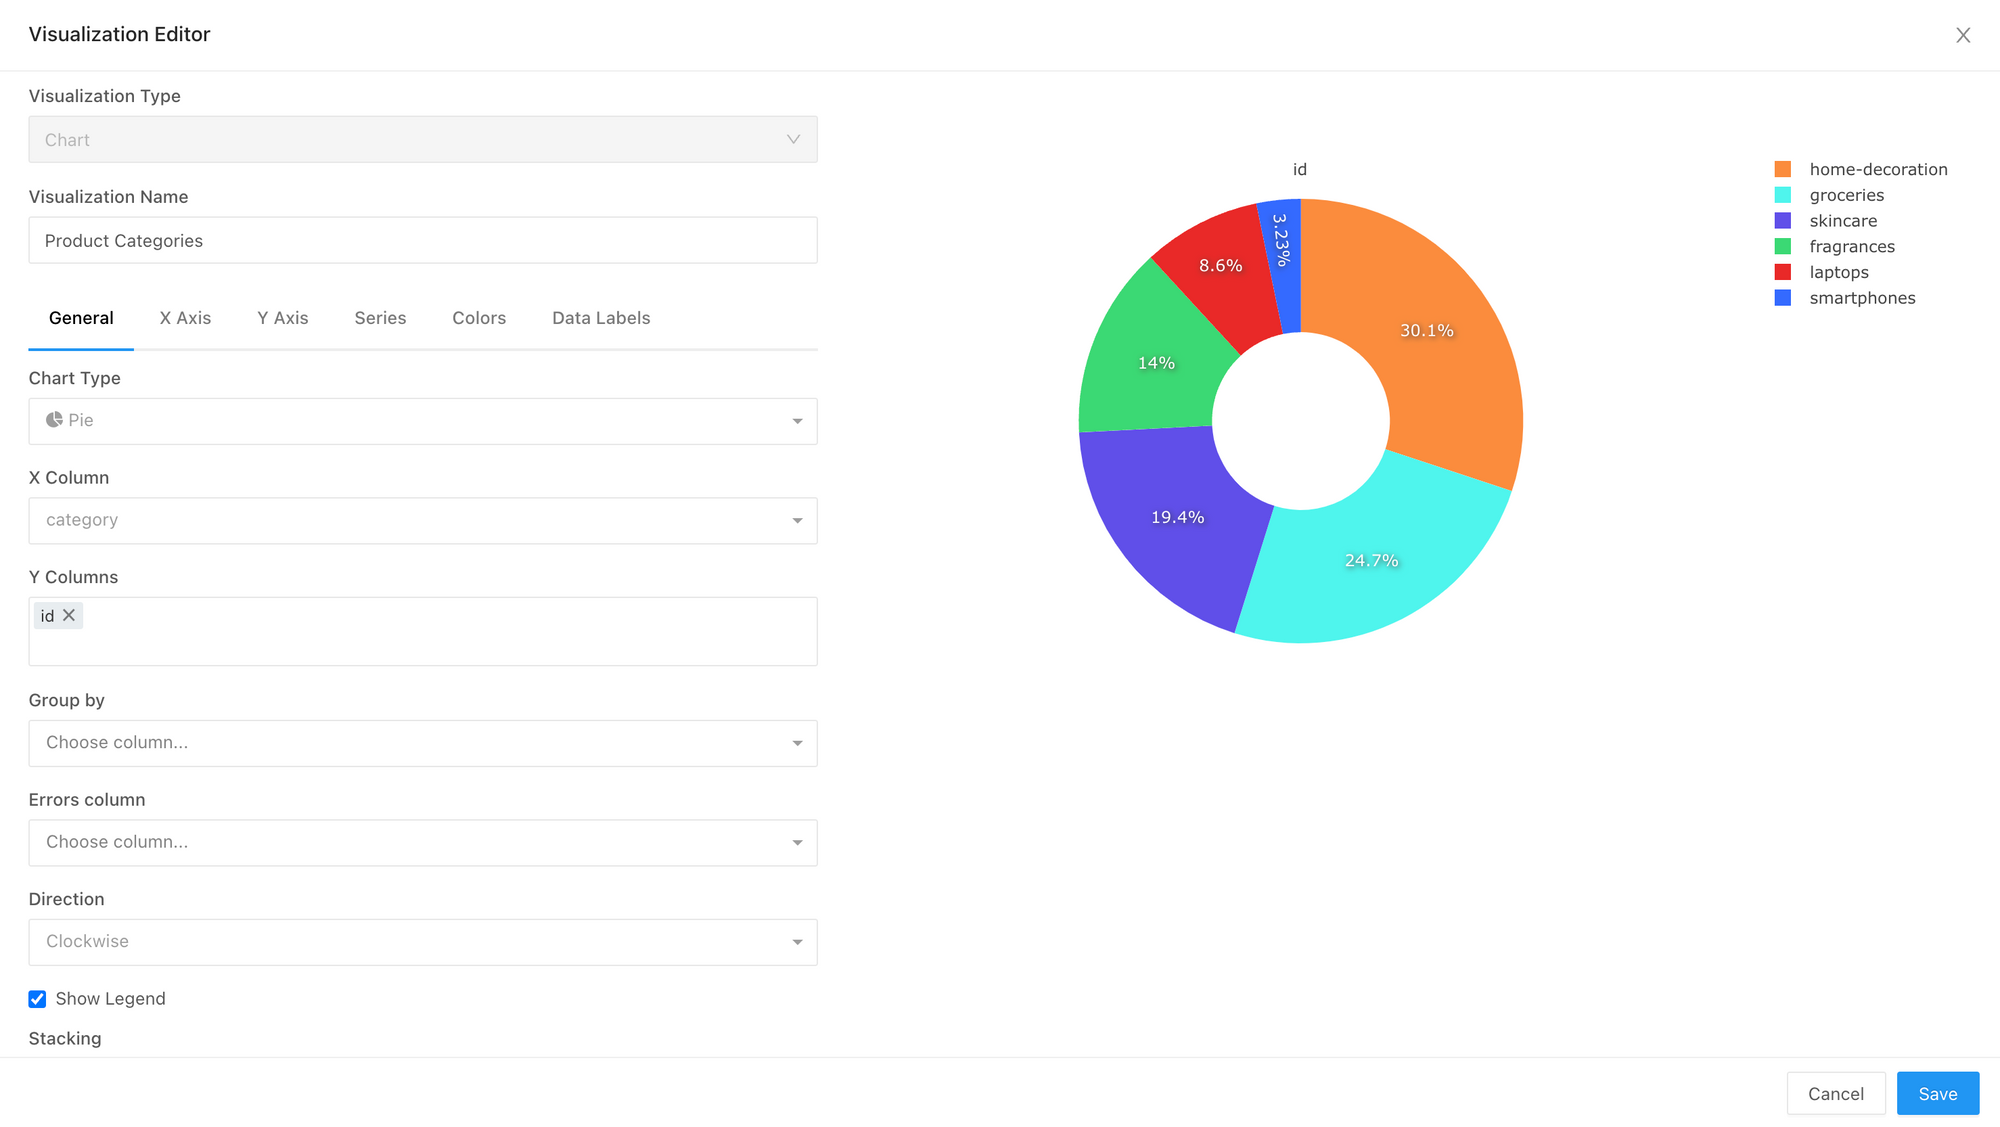
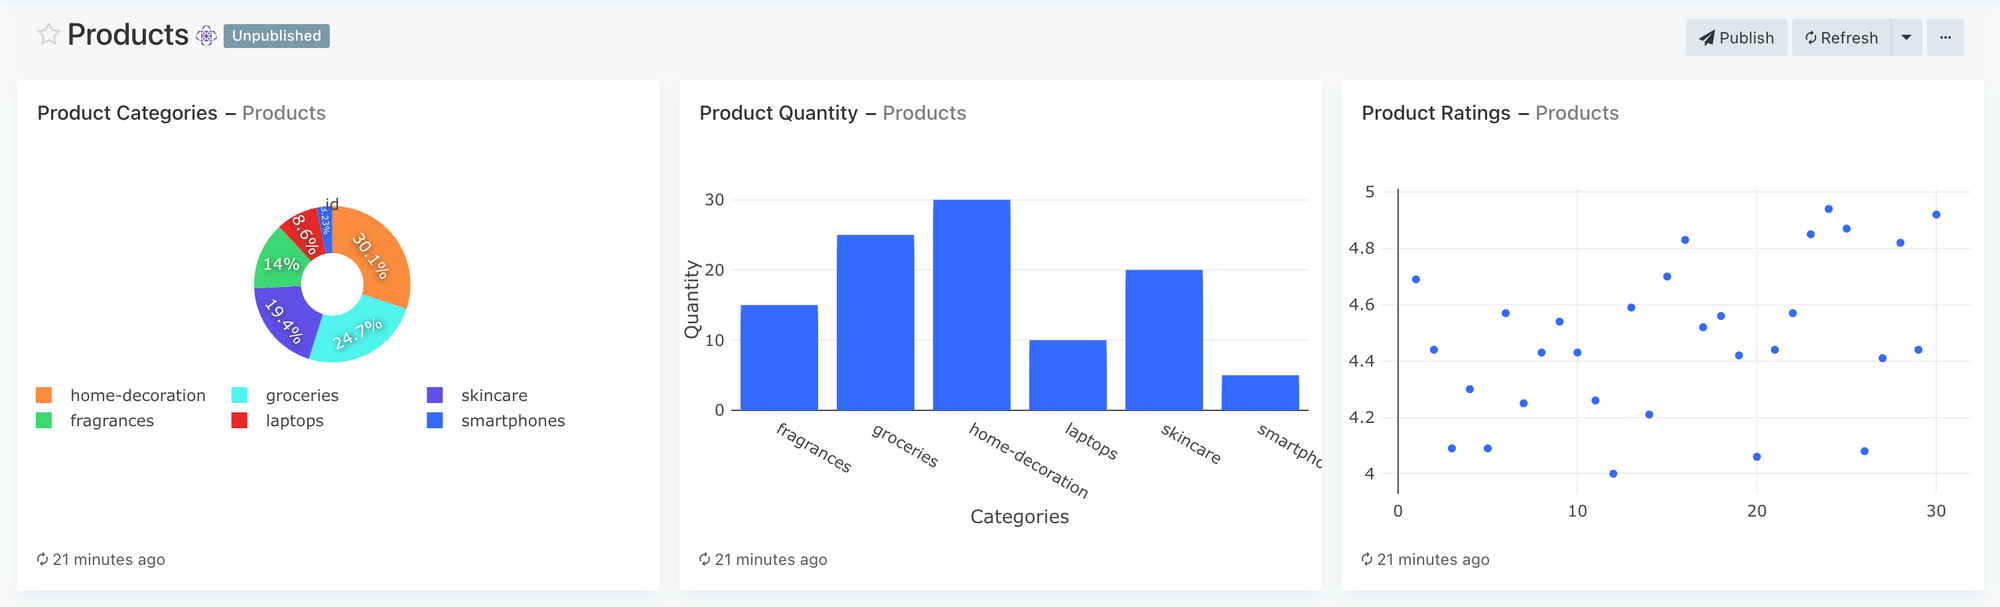
Using the ingested product data, I created three simple charts - a pie chart for the categories, a bar chart for the quantities, and a scatter chart for the ratings. Finally, click Create > Dashboard to create a new Products dashboard, and add the previously created visualisations as widgets.
That's it! Redash makes it ridiculously easy to ingest data from a wide variety of data sources, and create relevant visualisations and dashboards for reporting and tracking purposes. Get your hands dirty and play around with the other options available. Also, here's a brief video from Redash walking through the above steps, albeit with a different data source.